High Speed Active Oscilloscope Probe
A 1 GHz probe developed from a differential OPA858 simulation into single-ended hardware, followed by stability and input-impedance measurements.
Overview
This project explored a compact 1 GHz active oscilloscope probe, beginning with a differential architecture and continuing through two single-ended hardware iterations. The work combined circuit simulation, spectrum analysis, and VNA measurements to understand both amplifier stability and the probe’s input impedance.
Circuit Design
The original design was supposed to be differential, with two OPA858 input stages, and a third stage to convert the difference to a single-ended output for the oscilloscope. The OPA858 is a decompensated amplifier with a gain-bandwidth product above 5 GHz (which would later turn out to be very important).
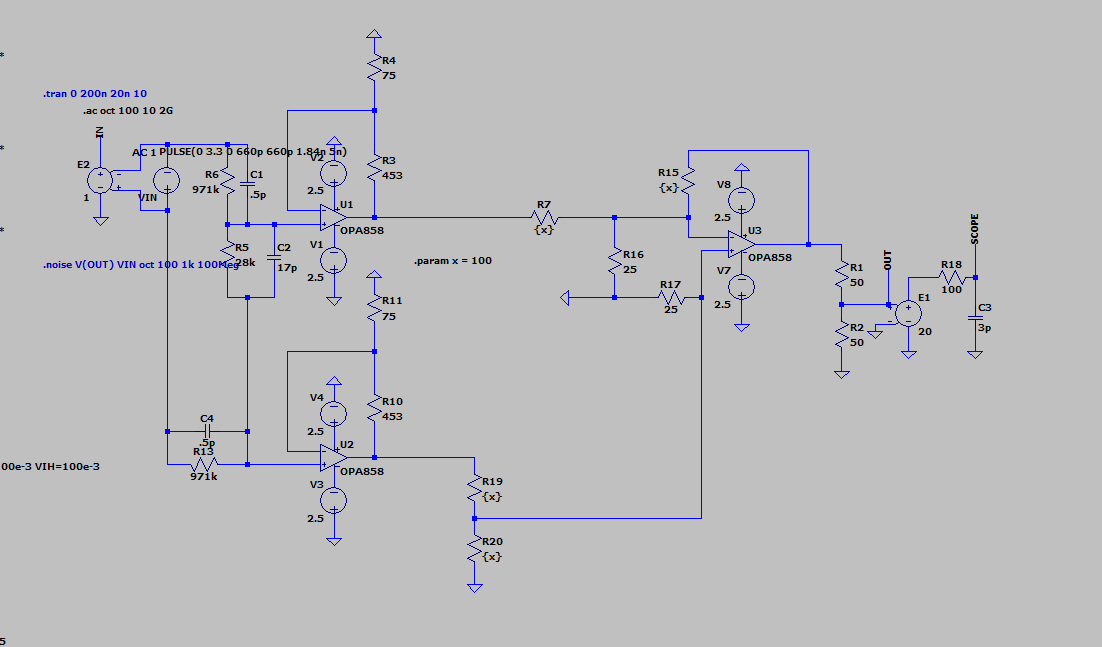
The original differential OPA858 design in LTspice.
The simulated response was essentially flat through the hundreds of megahertz, reaching -3 dB at approximately 1.10 GHz.
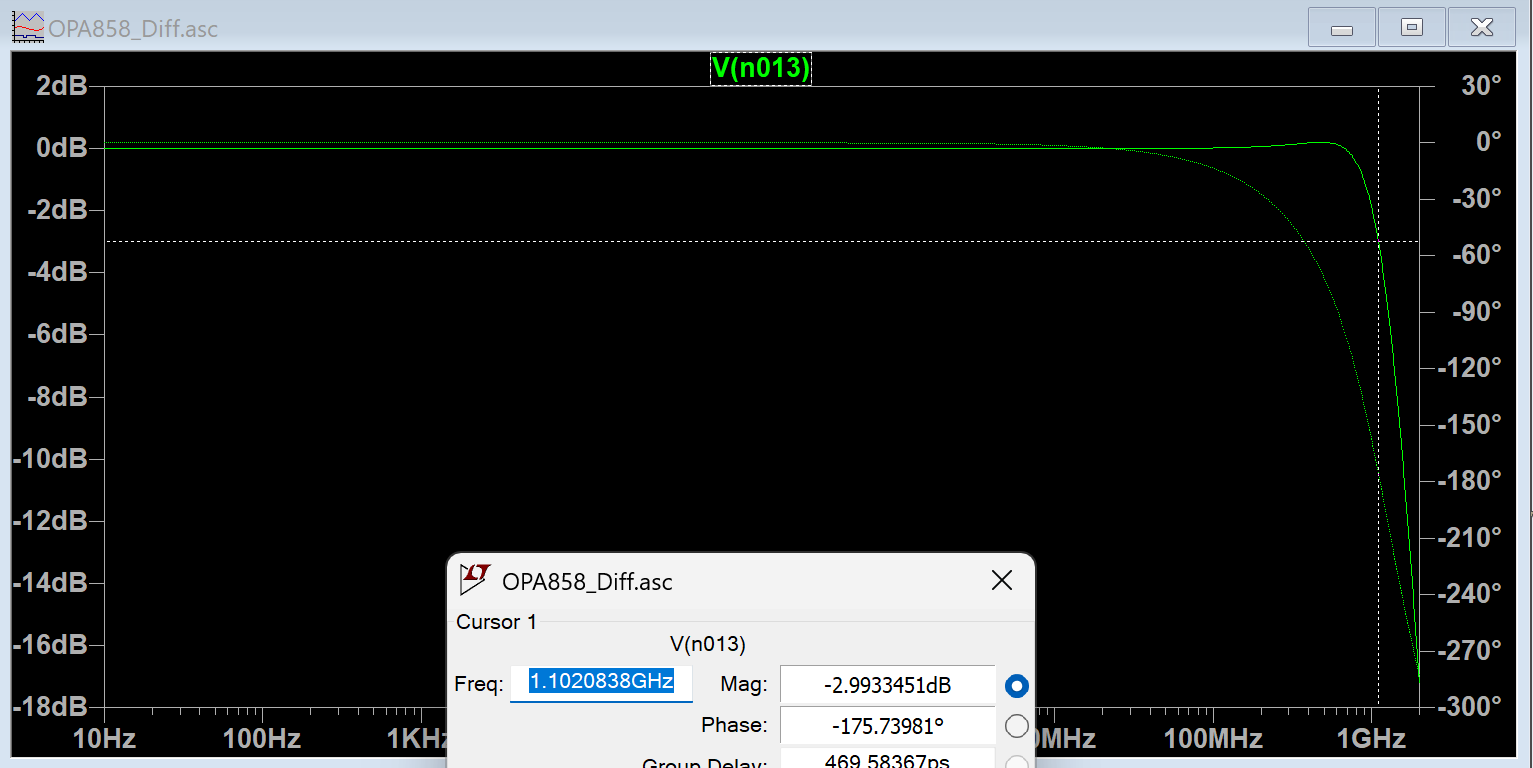
Simulated differential-probe response, with the -3 dB point at approximately 1.10 GHz.
To simplify the hardware, I reduced the design to a single-ended signal path. The 971 kΩ/14 kΩ input divider and its parallel capacitors provide frequency-compensated attenuation, the 453 Ω/75 Ω feedback network gives the OPA858 a closed-loop gain of about 7 V/V, and the 50 Ω source-and-load network produces a nominal 20:1 probe response.
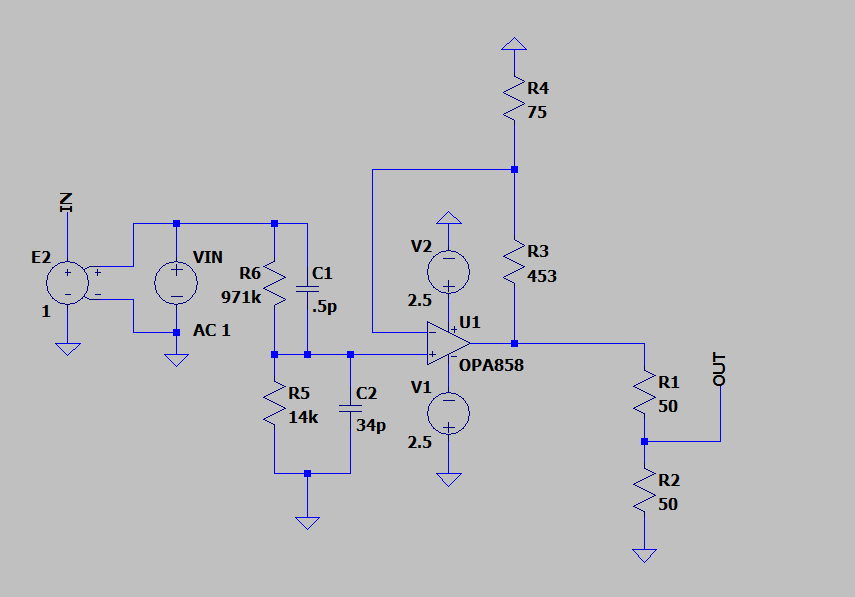
The simplified single-ended circuit used for the hardware prototype.
Unfortunately, the very large GBW also made layout critical. The undamped trace between the compensation capacitor and the input of the amplier caused the amplifier to oscillate at 1.184 GHz; the spectrum analyzer measured the narrow tone at approximately -4 dBm.
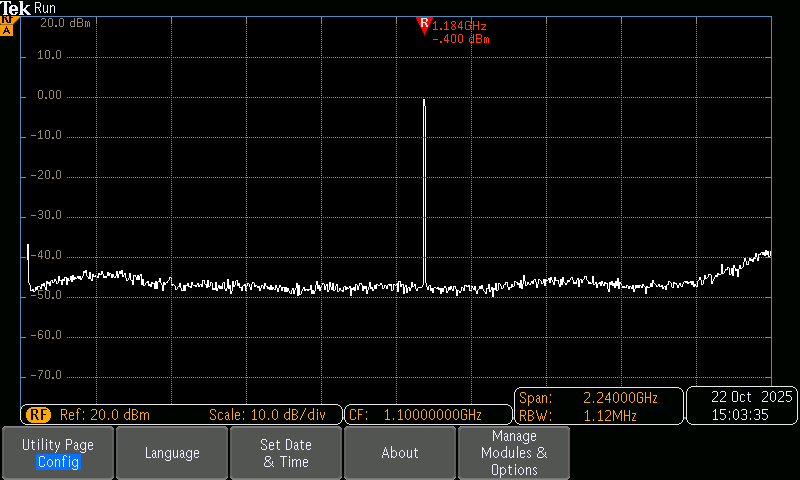
The layout-induced 1.184 GHz oscillation measured on the first PCB.
Hardware iterations
To fix this, I made a second version with an open loop BUF602 buffer I had on hand. Unfortunately, this would ultimately mean that the input impedance wouldn’t be as good, since the input divider plays a big role in reducing the input capacitance.
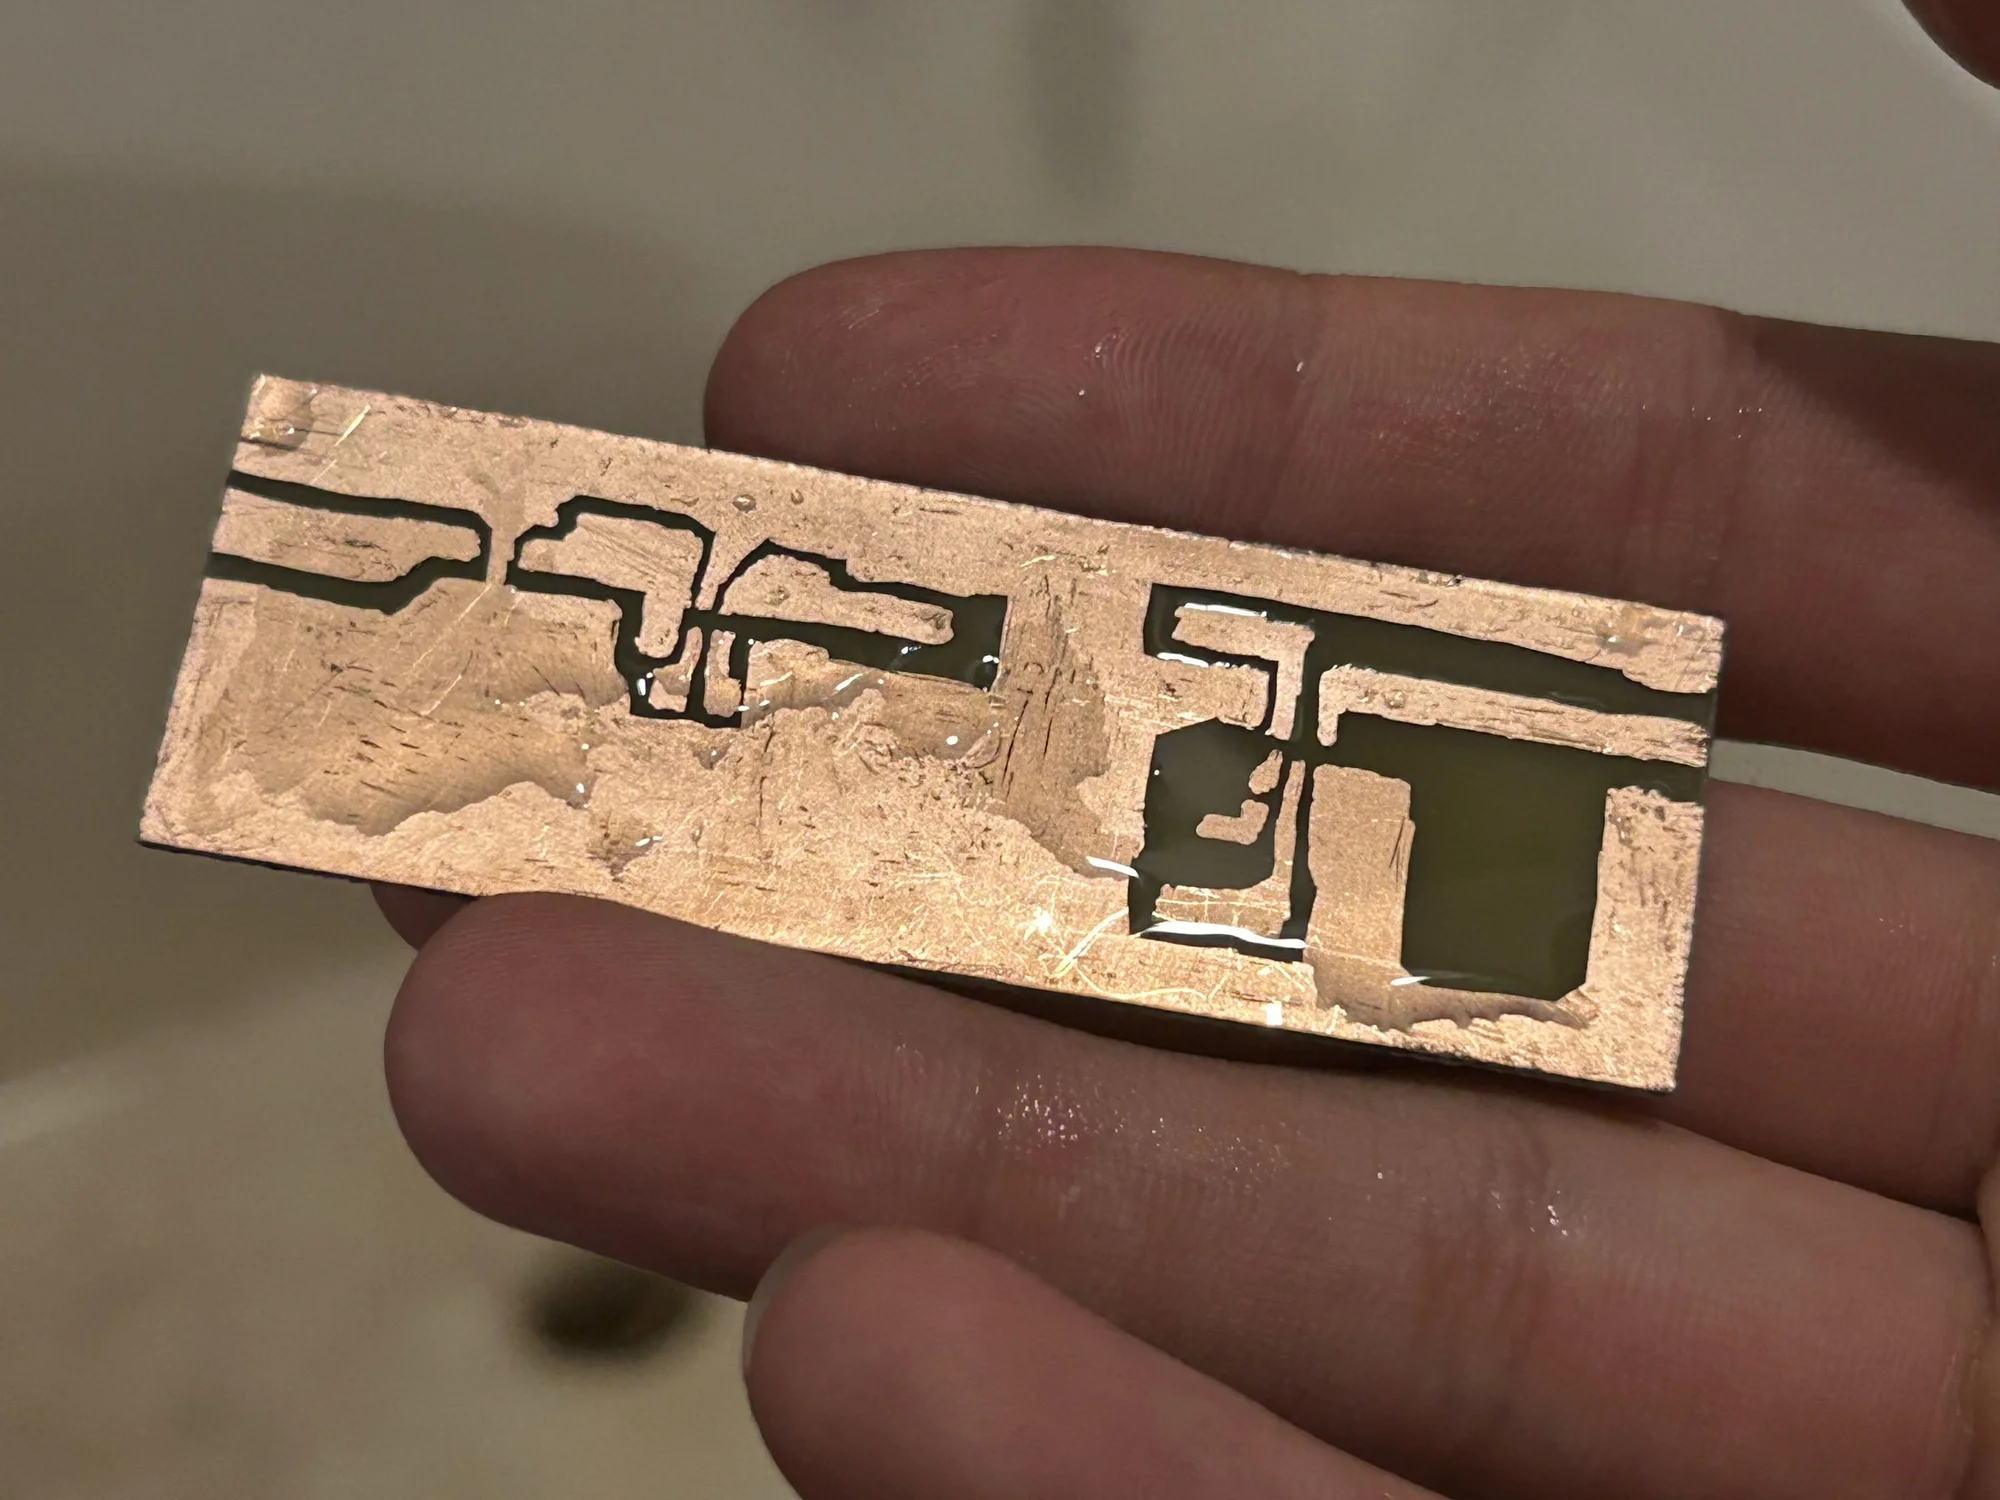
The etched probe PCB before assembly.
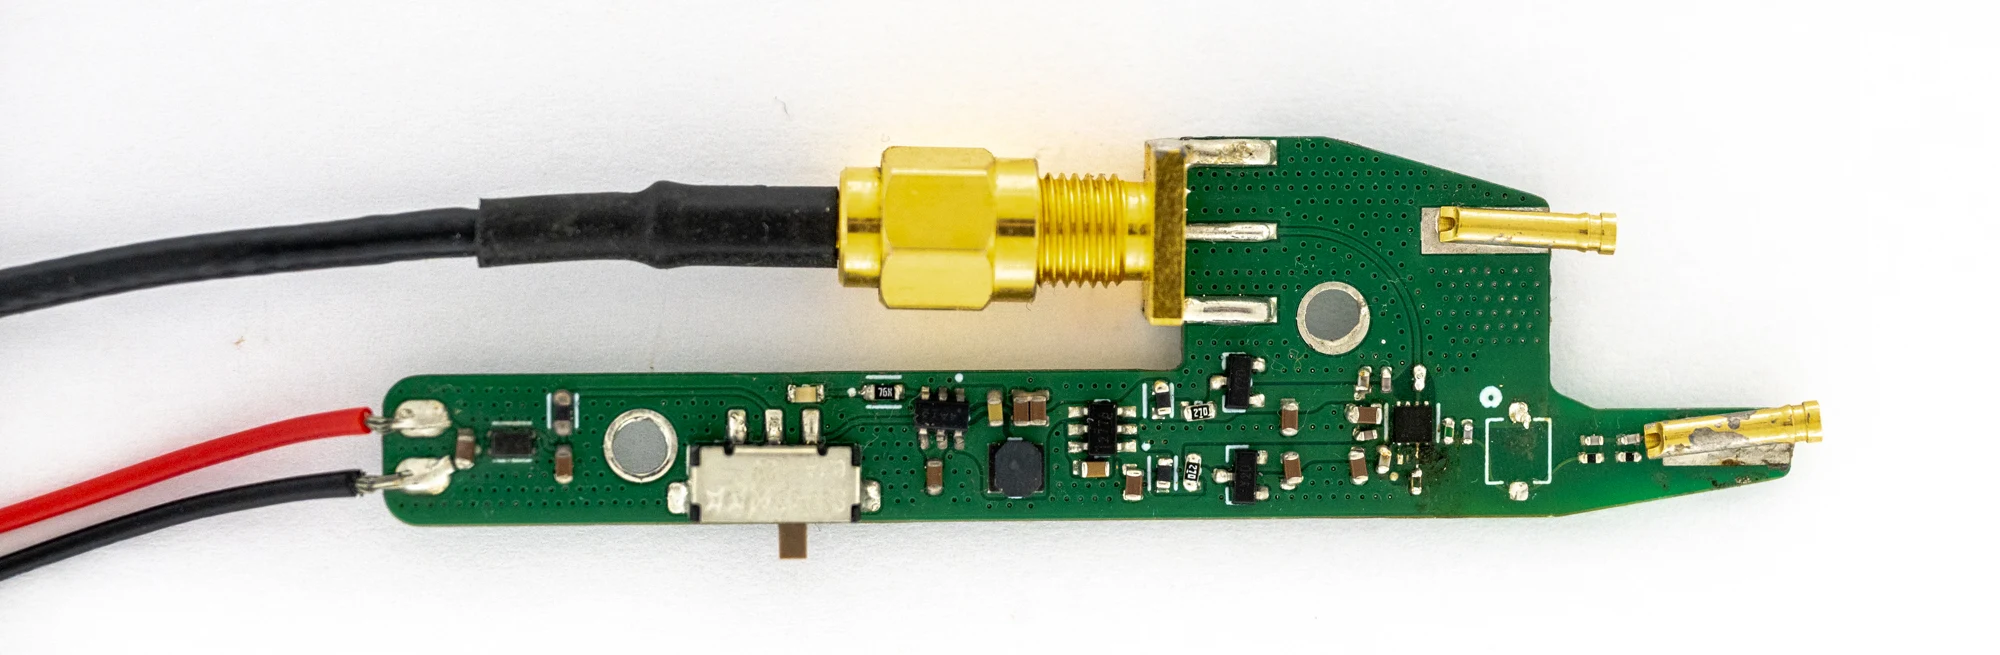
The first prototype PCB.
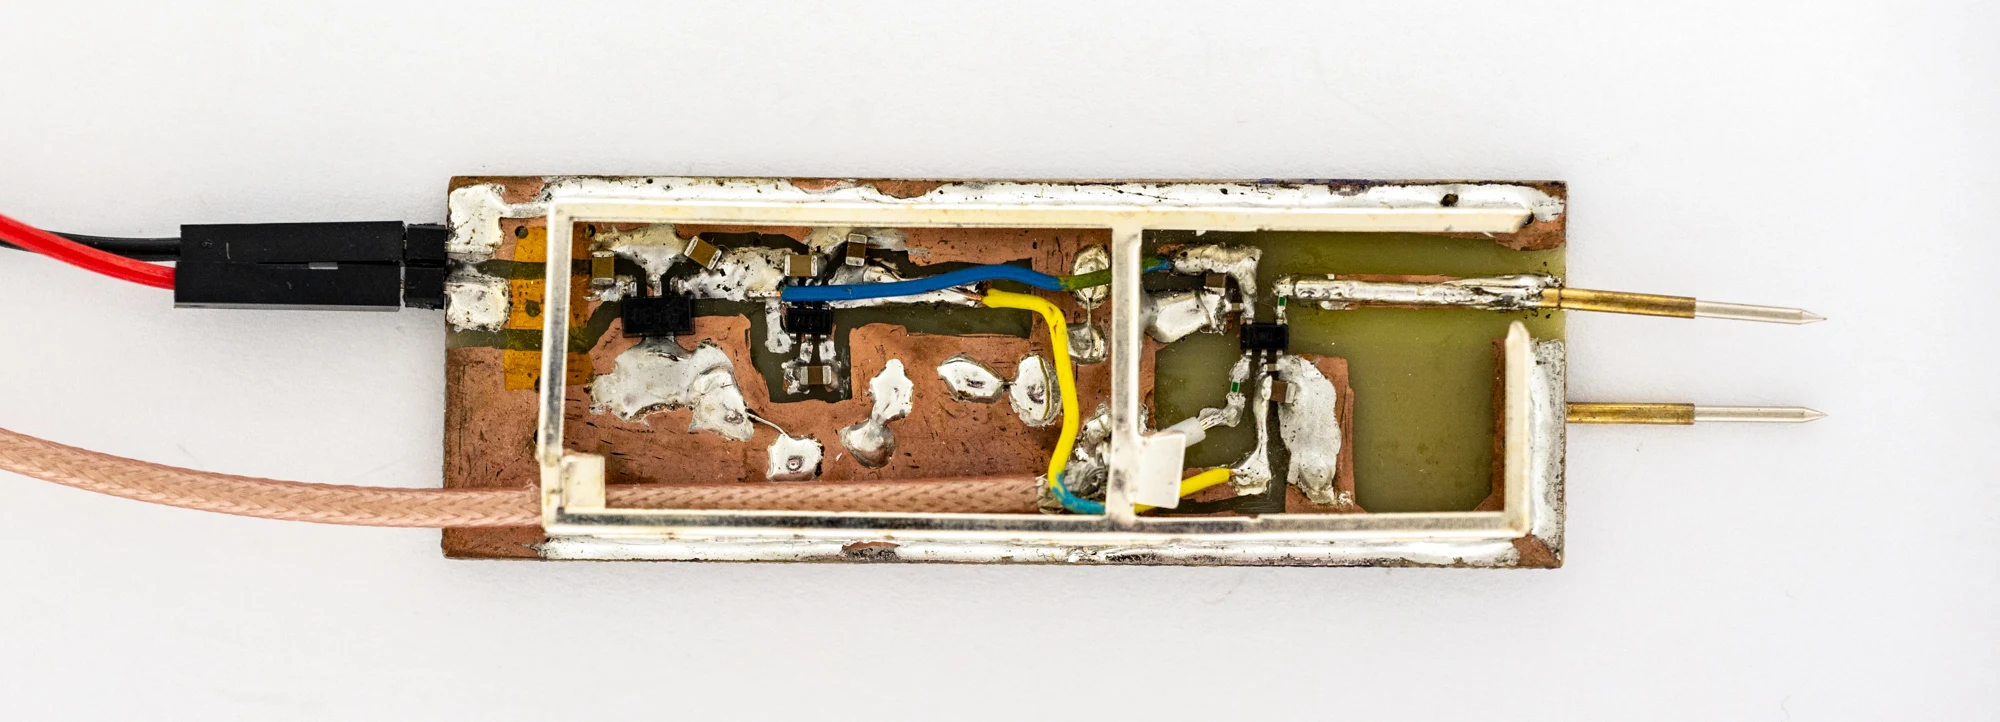
The second, handmade revision.
Input-impedance investigation
I used a VNA to measure the input impedance. I measured the impedance with nothing connected to the VNA to find the parasitic capacitance before measuring with the probe, and then corrected to get only the probe impedance in Excel.
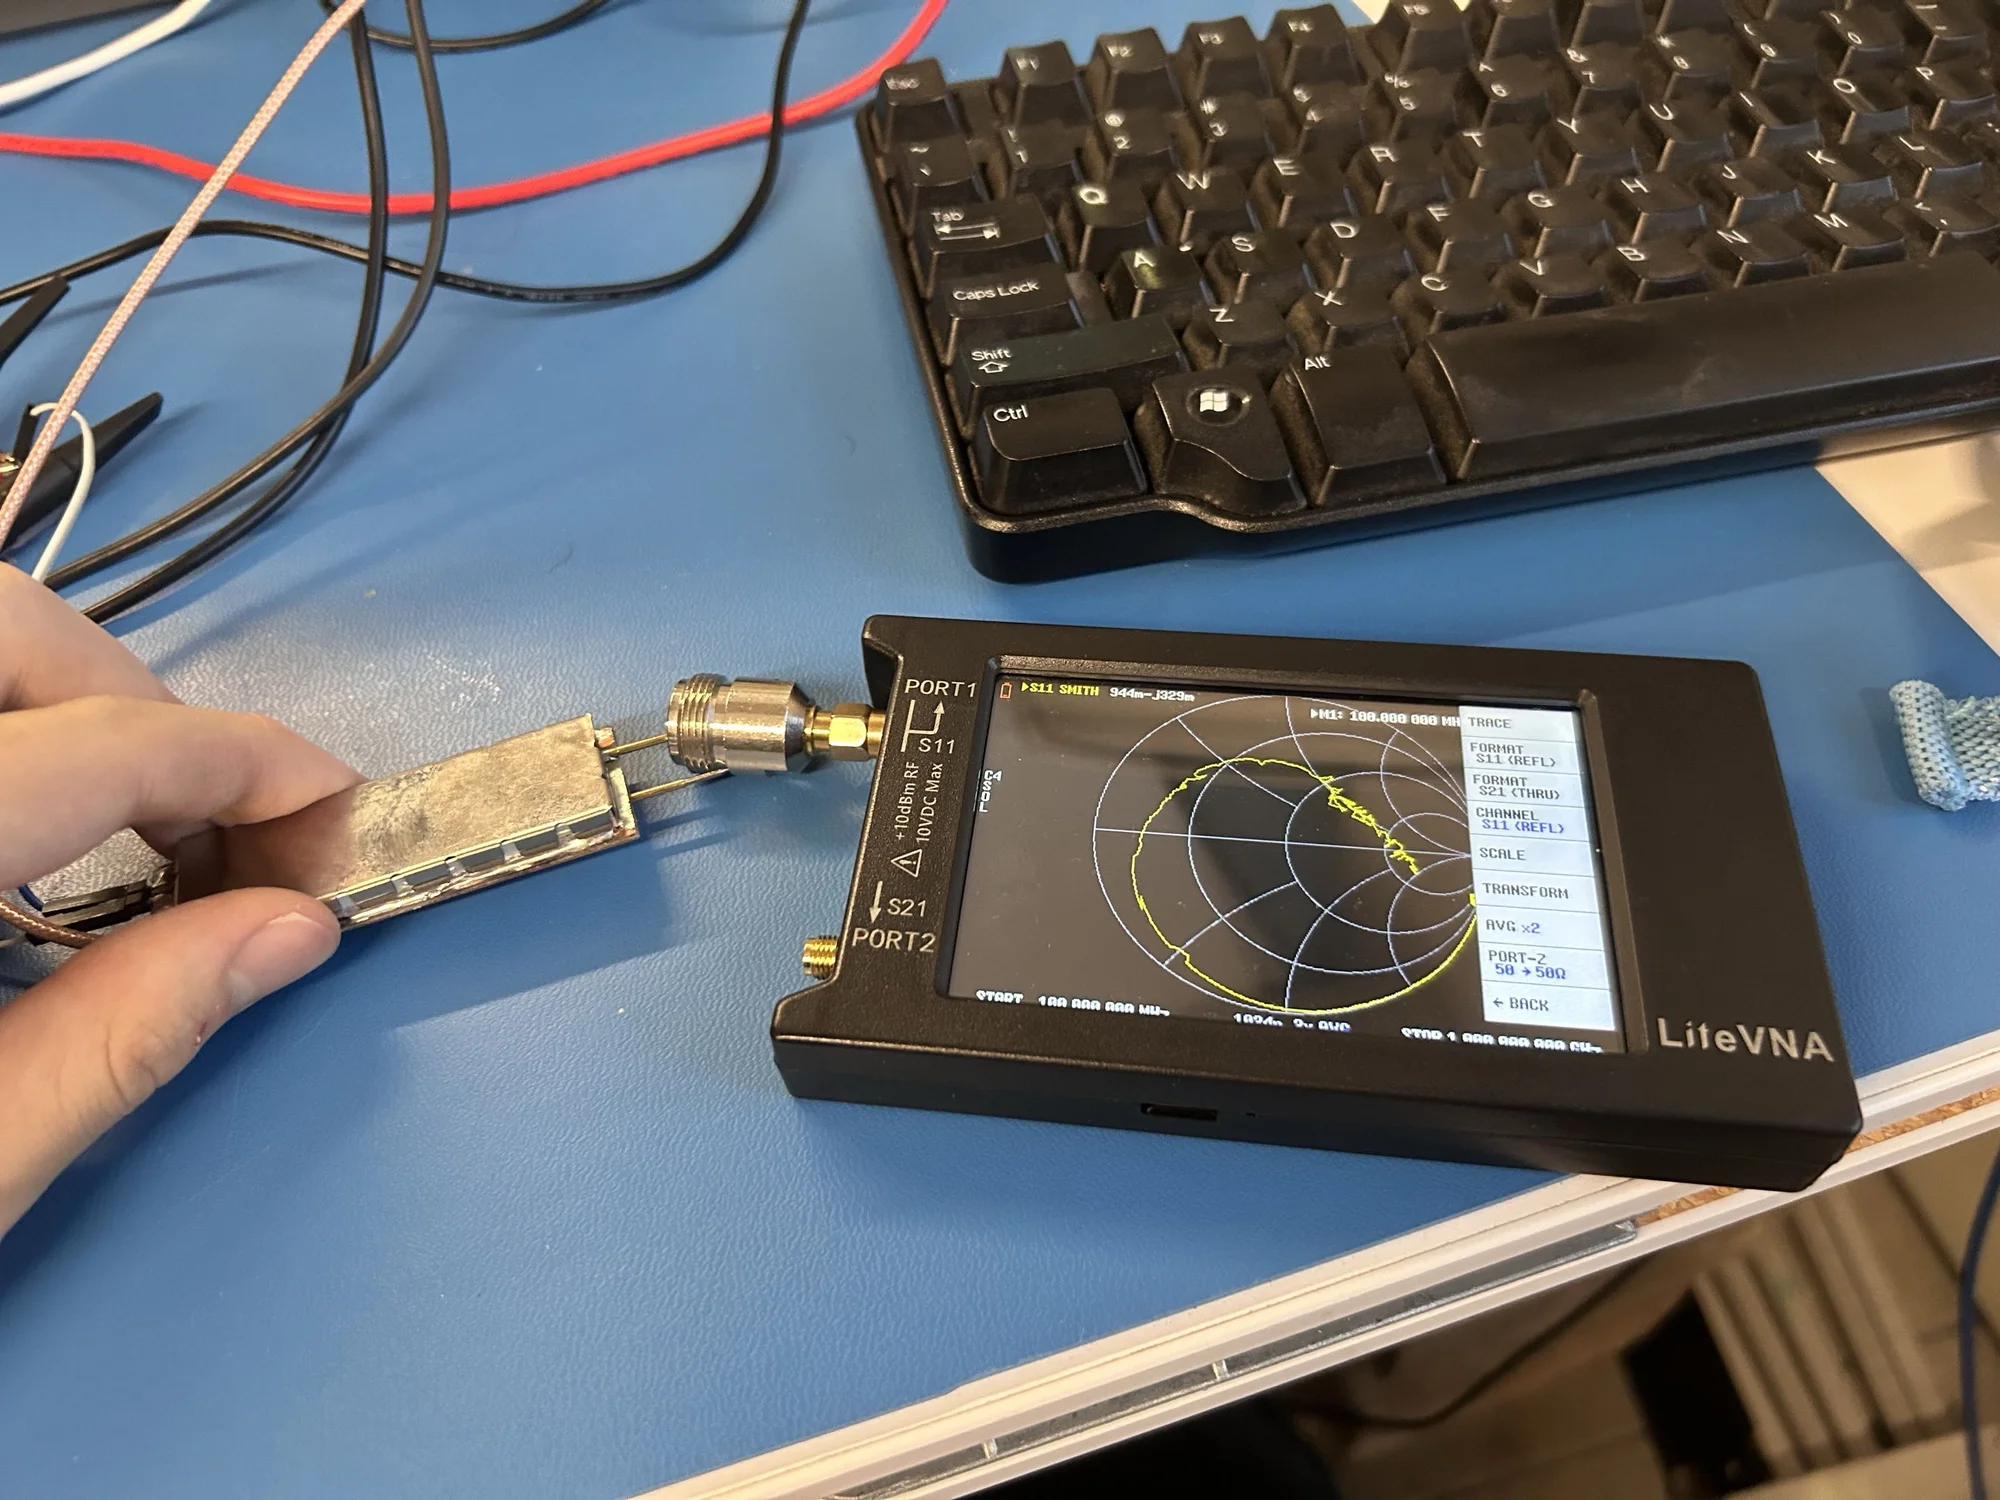
Bench setup for the VNA measurement.
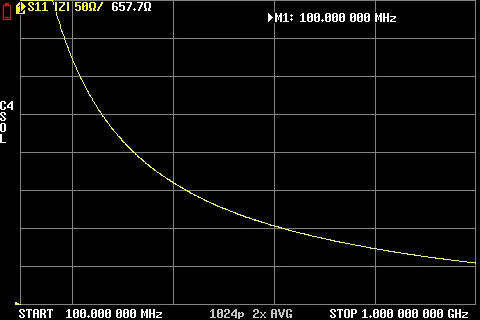
Input impedance without the probe, showing the VNA-input parasitic.
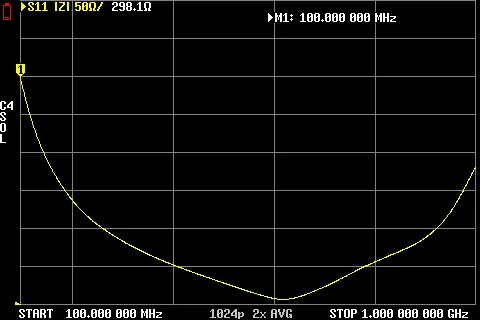
Input impedance with the probe connected.
The second revision’s input impedance was also compared with an equivalent capacitance before damping was added. The measured curve did not behave like a simple capacitor at high frequency.
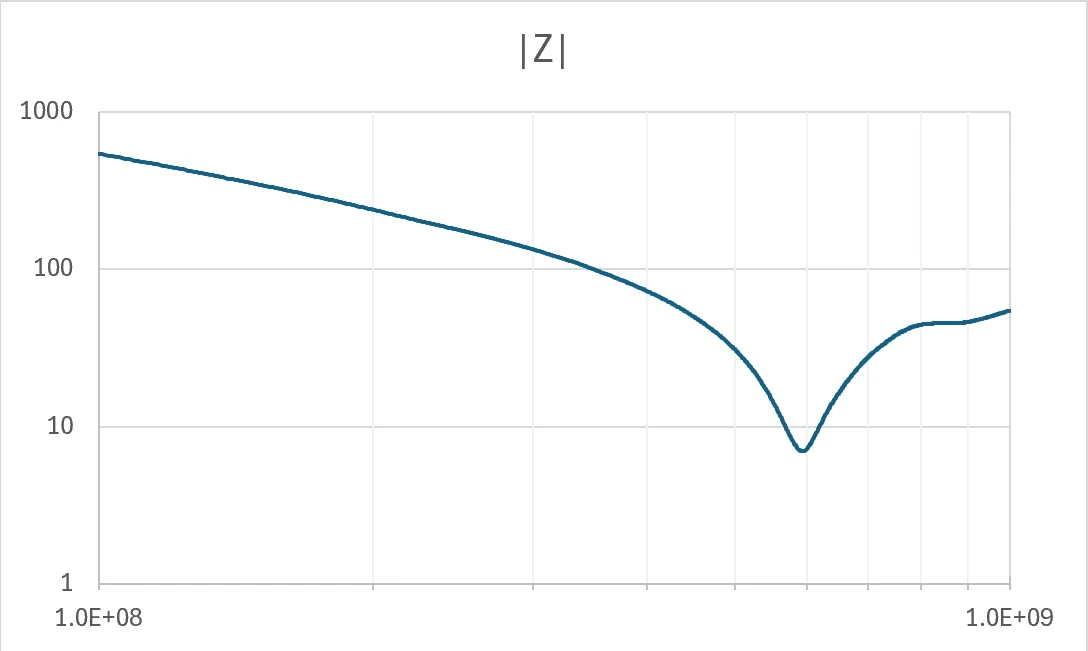
An impedance-magnitude sweep used during the input-model investigation.
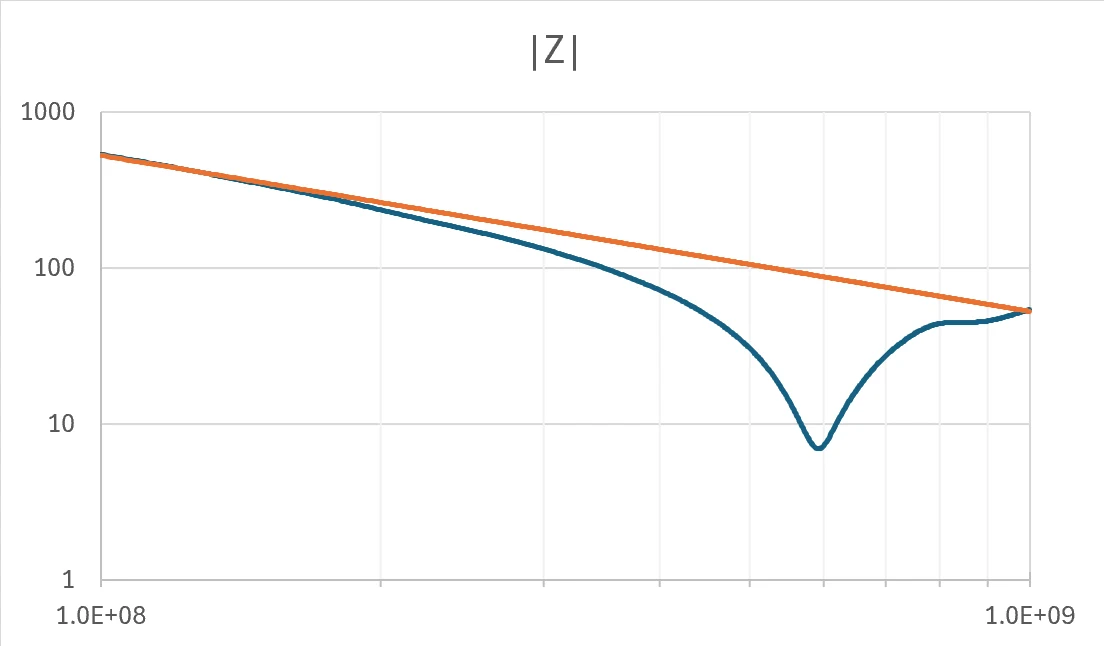
The second revision before damping, compared with an equivalent capacitance.
Modeling the resonance
I reproduced the impedance feature in LTspice with an equivalent RLC network. That model identified input inductance as the cause of the resonance and provided a direction for damping the next revision.
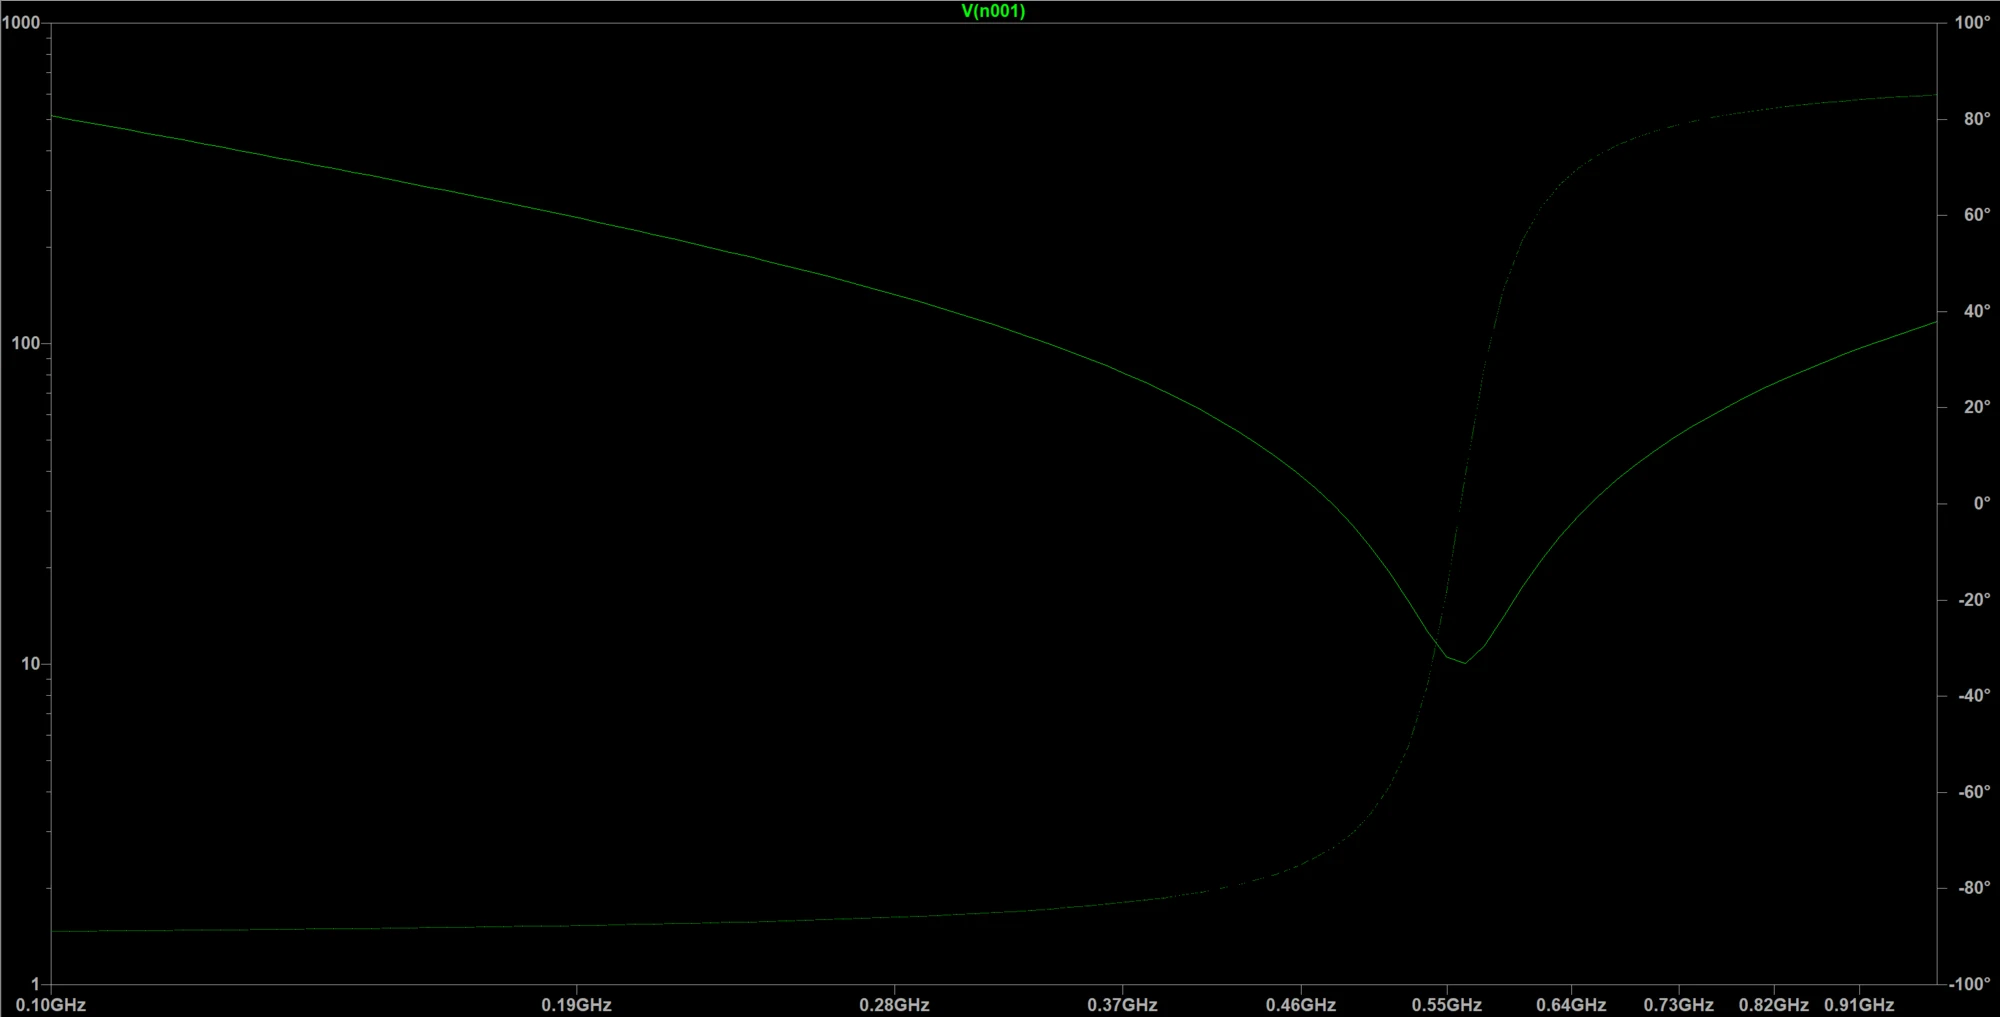
Equivalent-network simulation used to isolate the effect of input inductance.